
From Excel to a Web App: Room Occupancy Page
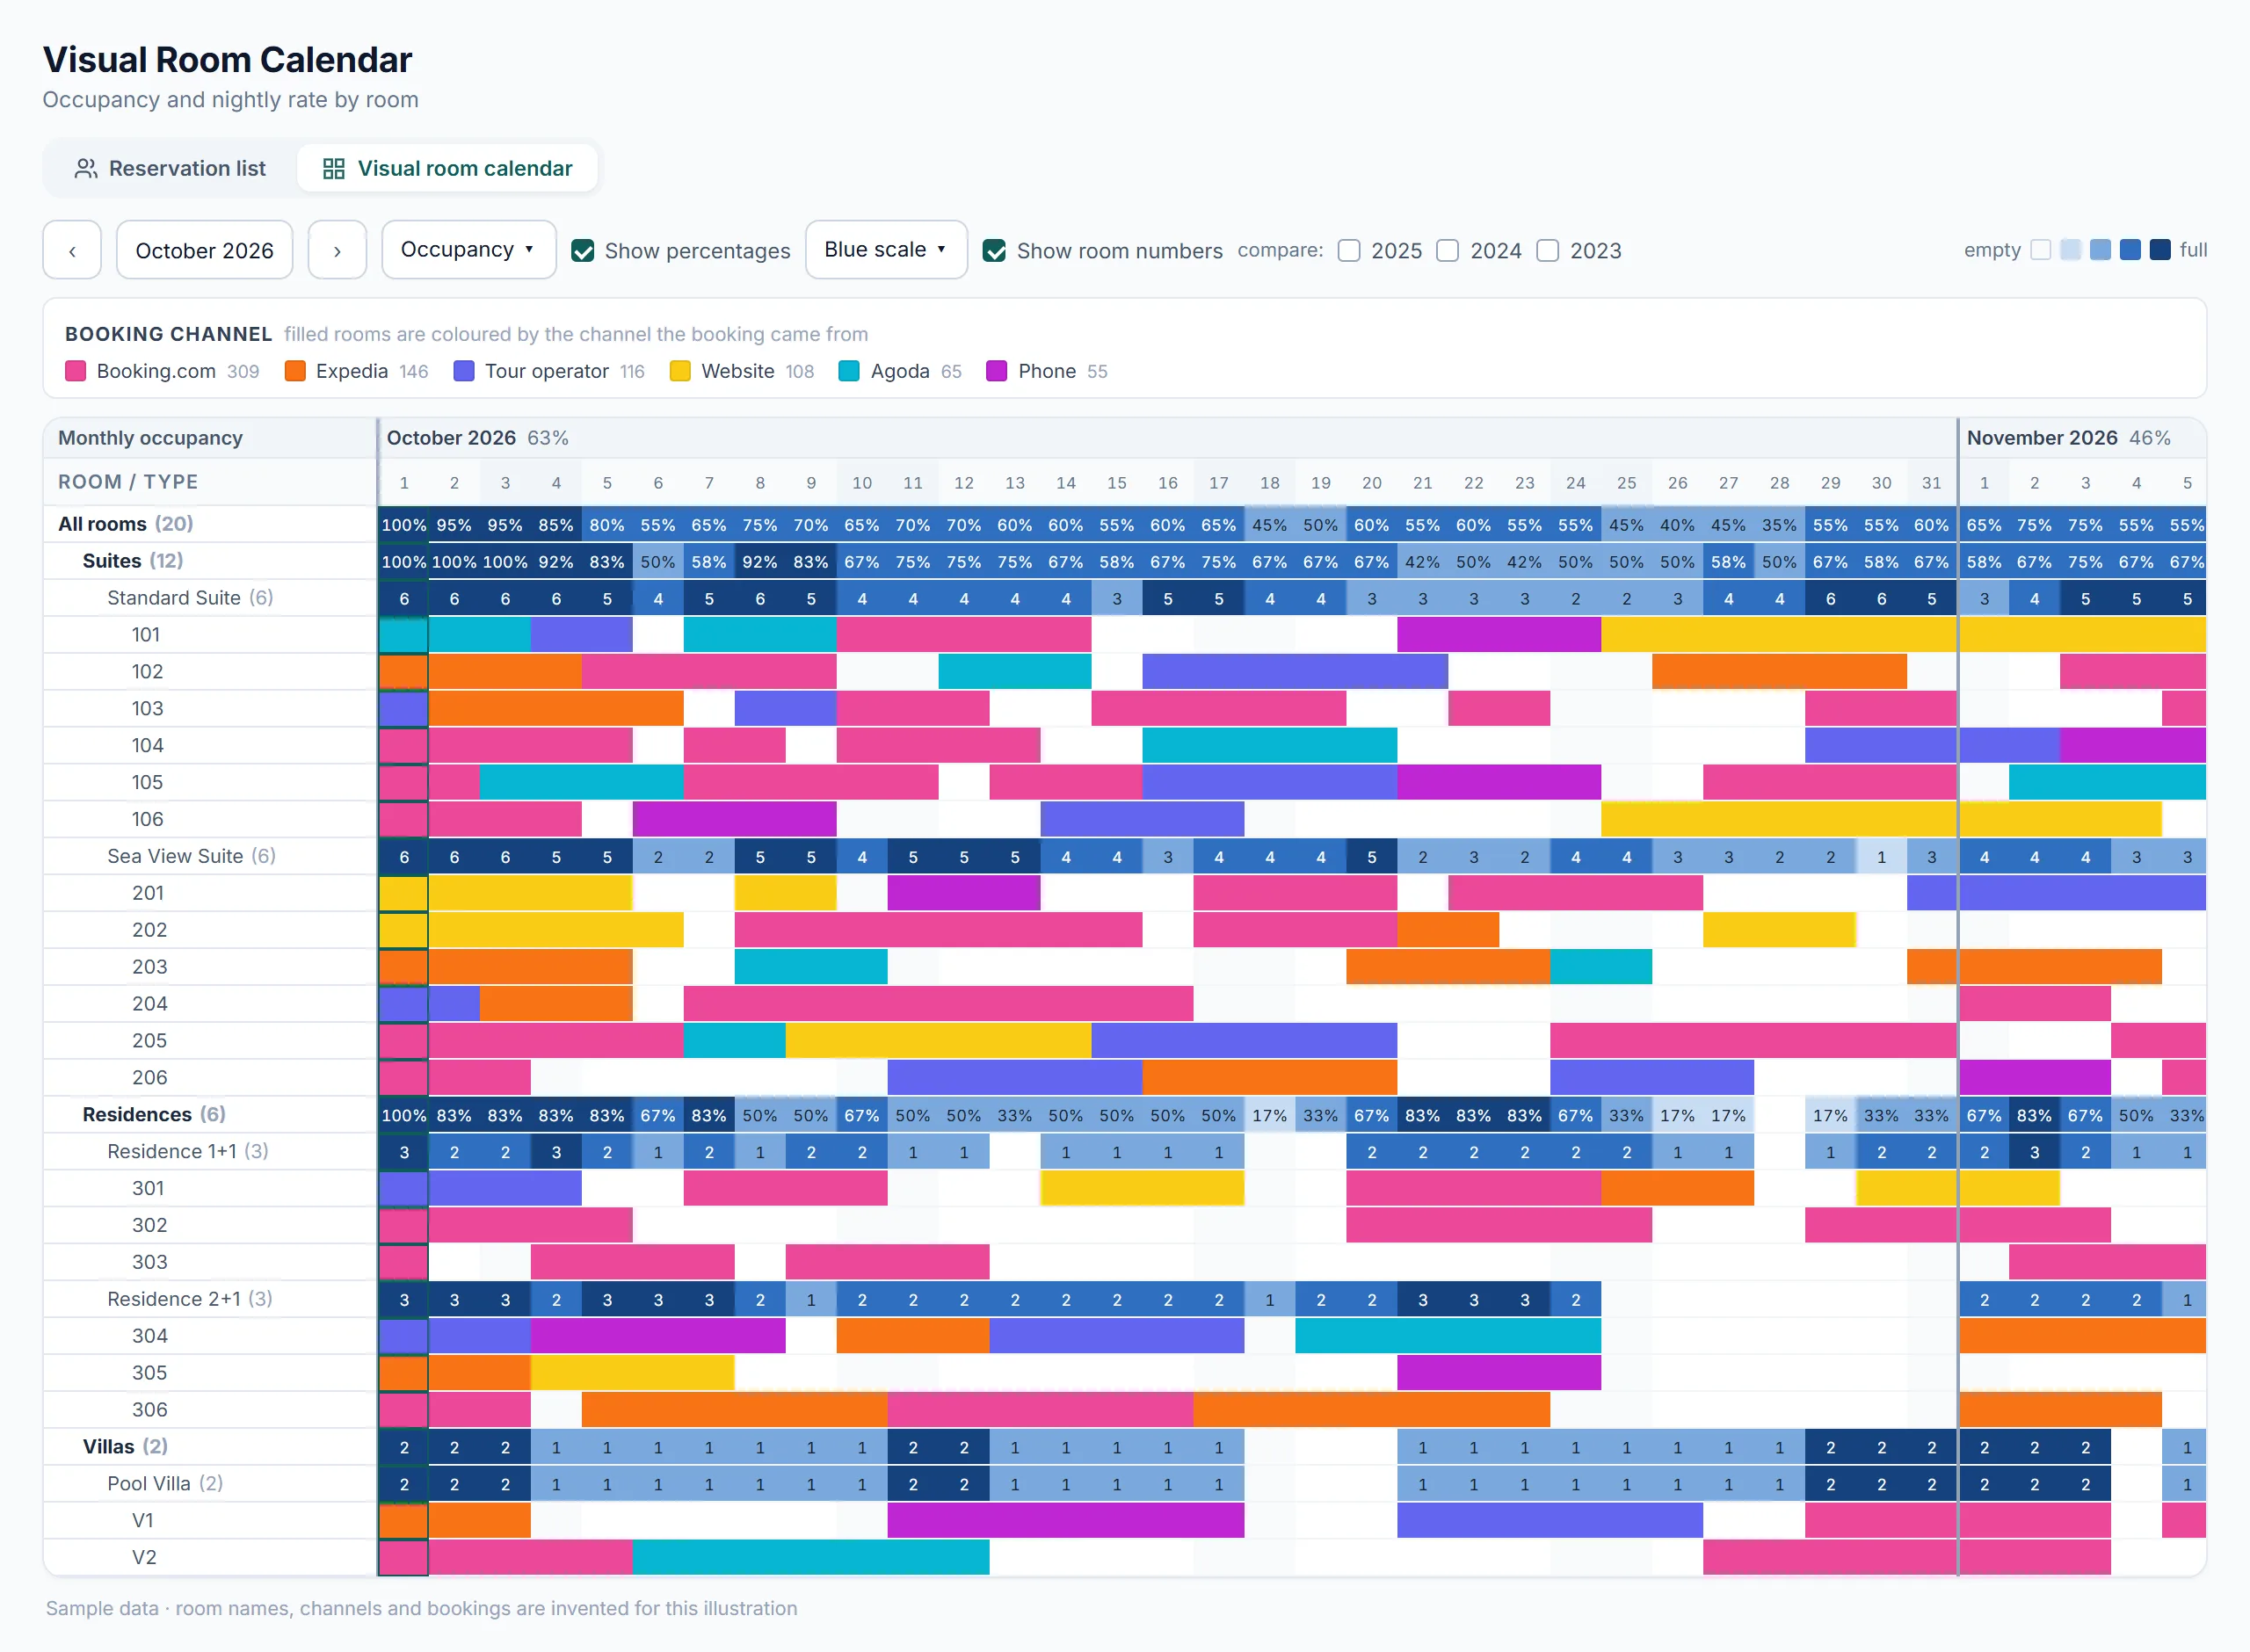
Many hotels still track occupancy in an Excel or Google Sheets month grid. Rooms run down the rows, days across the columns, and someone colours in the nights when a booking arrives. For a boutique hotel, I turned that grid into a web page that feeds itself from the booking system every day. It is one of the pieces of software I build for hotels. The screen below is that page drawn with sample data.
Where does the occupancy spreadsheet break down?
The month grid is a good idea: at a glance it shows which room is taken on which night. The problem is the work that keeps it filled:
- Someone types in every booking. A cancellation, a date change or a room move can easily miss the sheet.
- Two versions of the truth appear. At this hotel, the old sheet, set side by side with the booking system, showed one month’s revenue about 45% higher than it really was. Once two sources drift apart, nobody knows which one is right.
- Every month is a separate tab. Comparing with the same period last year means opening another file.
- The channel is invisible. A cell is filled, but whether the booking came from Booking.com, the phone or a tour operator is not in that sheet.
What does the web page do differently?
- Nobody enters data. The page reads the records coming from the hotel’s booking system every day. Cancellations and room moves show up the next day. Several years of history sit in the same place.
- Four levels, from room to hotel. The whole hotel sits at the top, room groups (suites, residences, villas) below it, room types below those, and individual rooms at the bottom. The upper rows show daily occupancy as a percentage or as the number of rooms taken.
- Colour tells you the booking channel. A single room is either taken or empty on a given night, so the colour in a room row shows the channel the booking came from rather than occupancy. Above the table, each channel’s colour is listed with the number of nights it brought in during that period.
- Hovering over a cell opens the details. Guest name, channel, length of stay, check-in and check-out dates, nightly rate.
- Three months at once. The arrows move the window one month at a time. Each month heading shows that month’s occupancy rate.
- The same screen works for rates. In the “nightly rate” view, cells show the average nightly rate. Euro, lira, dollar or pound can be selected; conversion uses that night’s exchange rate, not today’s.
- A fair comparison with last year. With comparison switched on, the screen answers the question what did we have on the books on this date last year. Days that are ahead turn green, days that are behind turn red. What matters is where you stand today, not how last season finally ended.
- Links can be shared. The view you are looking at is written into the address, so you can send a link that says “look at this screen”.
How is it set up for your hotel?
The starting point is the spreadsheet you already use. Its row layout, its colours and who looks at what already describe the need. Next, I look at how your booking system’s data can be accessed. That differs from system to system, so I do not quote a time frame or scope before checking it. The first version is only the occupancy grid. The rate view and the comparison with last year come once the grid has proved useful.
This page does not replace your booking system; it reads its data and writes nothing back to it.
Frequently Asked Questions
Do we have to give up our booking system?
No. The occupancy page reads and displays the records in your booking system. You keep taking bookings, managing channels and entering rates in the system you already use.
Is the data in the screenshot real?
No. The design is identical to the screen in the panel I built for a hotel. Room names, channels and bookings are invented for this illustration. Guest names and revenue figures from the real panel are not shared.
Do we have to drop our spreadsheet completely?
You do not have to. If you want to keep receiving the data as a table, an export can be added. But if the same information keeps being typed into both the sheet and the system, the problem of two different figures stays too.
Who can see the occupancy page?
Only team members who sign in. The page is not public; which user sees which screen is decided during setup.
Let’s look at your hotel’s spreadsheet together
Use the contact page to tell me about the occupancy sheet and booking system you use. For other examples, see custom web apps for your team.